Free investment guide
Stocks look stretched? See how gold fits.
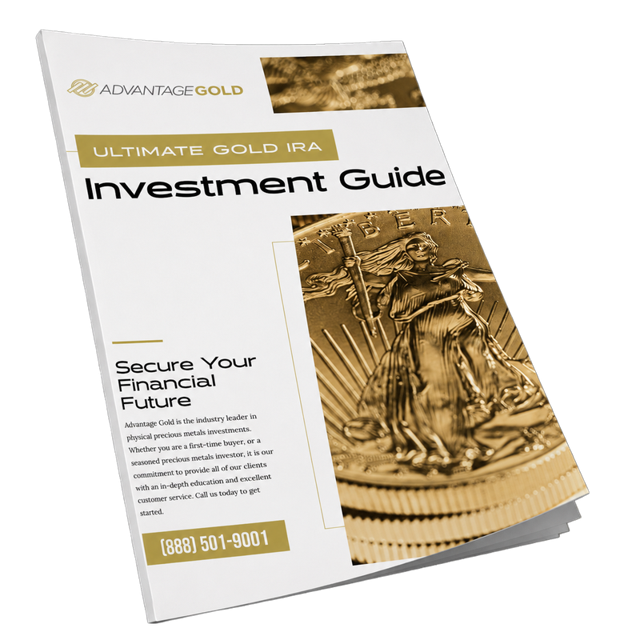
Rollovers, eligible coins, storage and fees, all explained in plain English. Free, with no obligation.
Market valuation tool · Updated daily
The S&P 500's price divided by its average inflation-adjusted earnings over the past 10 years. A full decade of earnings smooths out booms and recessions, which is why it is one of the most trusted long-run measures of how expensive stocks are. The long-run average is about 17.
The latest data could not be loaded. Please try again in a moment.
150 years of history
Red marks the peaks before a crash, green the lows that followed. Notice how rarely the market stayed above 24 before 2000, and how often it has since. Hover or tap the line for any month.
What came next
For every month since the 1880s, we looked at the starting CAPE and at what the S&P 500 returned over the following five and ten years, with dividends reinvested. The higher the starting point, the lower the typical return.
| Starting CAPE | Months | Next 5 years, typical | Worst to best (5 yrs) | Next 10 years, typical | Worst to best (10 yrs) |
|---|
Average annual total return over the following period, before inflation, taxes and fees. Typical is the median of every starting month in the range.
An ordinary price to earnings ratio divides the stock price by one year of profits, and one year can be misleading: profits collapse in a recession and swell in a boom. The CAPE uses the average of the last 10 years of earnings, adjusted for inflation, so a single good or bad year cannot distort the picture.
A reading of 20 means investors are paying $20 for every $1 of typical annual earnings.
Robert Shiller showed that the starting CAPE has said a lot about the following decade's returns. Buying when it was low has usually led to strong results, and buying when it was high has usually led to weak ones. The table above shows that pattern in the data.
It reached its highest level on record at the end of 1999, shortly before the dot-com crash. Other readings above 30 came just before the 1929 crash and in most years since 2017.
The CAPE is not a timing tool. Stocks can stay expensive for years, and some analysts argue it now runs structurally higher than in the past because of changes in accounting rules, more share buybacks and lower interest rates for much of the last two decades.
What it does show is how much optimism is built into prices, and how much room there is for disappointment.
When stock valuations are stretched, many retirement savers look for assets whose value does not depend on corporate earnings. Physical gold has no counterparty and has often moved differently from stocks, which is why some investors hold part of their savings in it through a Gold IRA.
Our free guide explains how a Gold IRA works and how a rollover from a 401(k) or IRA is handled.
The CAPE is the S&P 500's price divided by the average of its last 10 years of earnings, with both adjusted for inflation, as defined by Robert Shiller. Monthly figures since 1871 come from Shiller's data, and the current month's value is updated daily as the index moves. For the forward returns we combined the monthly S&P 500 price with its dividend yield, as if every dividend were reinvested, and grouped every starting month by its CAPE.
For educational purposes only. Advantage Gold is not a registered investment adviser, and nothing on this page is investment, tax or legal advice. Valuation measures do not predict short-term market moves, past performance does not guarantee future results, and precious metals involve risk. Please consult your own financial professional before making any investment decision.
More tools
Free investment guide
Rollovers, eligible coins, storage and fees, all explained in plain English. Free, with no obligation.