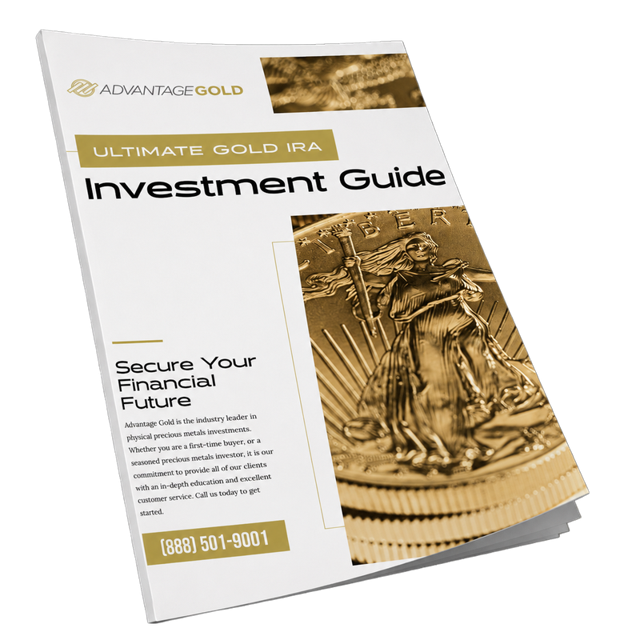
Free investment guide
Want gold in your retirement? See how it works.
Rollovers, eligible coins, storage and fees, all explained in plain English. Free, with no obligation.
Comparison tool · Updated through the trading day
Enter any amount and any period, and see what it did in gold and in the S&P 500, the Dow, the Nasdaq, oil or cash. Prices follow the market through the day.
Choose what to compare gold with, enter the amount, pick a period and press Calculate.
Results for
Spot price per troy ounce.
The latest data could not be loaded. Please try again in a moment.
Decade by decade
Which one came out ahead depends a lot on when you start. Each row shows the change over that decade, price only. The check marks the leader.
| Decade | Gold | S&P 500 |
|---|
A stock is a share of a company's future earnings, so stock prices tend to grow along with the economy over long periods. Gold has no earnings. Its value comes from scarcity and from its long role as money outside the banking system, which is why it has often held up when stocks or the dollar were struggling.
The answer changes a great deal with the start and end dates. Gold led through the 1970s and the 2000s, while stocks led in the 1980s, the 1990s and the 2010s. Try the decade buttons to see how different the result can be.
The chart shows price changes only. Stocks also pay dividends, which add to their long-run return, so the S&P 500 card shows the total with dividends reinvested when that data is available (from 1988). Physical gold pays no income and involves storage and insurance costs. Neither side includes taxes or fees.
Many investors hold gold alongside stocks rather than instead of them, as a portion of savings meant to hold its value when other assets fall. A Gold IRA lets you own physical gold inside a tax-advantaged retirement account, and our free guide explains how it works.
We take each asset's weekly closing price at the start and end of the period and grow your amount by the same percentage. Gold is the spot price per troy ounce. The S&P 500, Dow Jones and Nasdaq are index levels without dividends. Oil is West Texas Intermediate crude. Cash compounds monthly at the 3-month Treasury bill rate in effect each month, which is close to what money market funds paid. Results are before taxes, fees and storage costs.
For educational purposes only. Advantage Gold is not a registered investment adviser, and nothing on this page is investment, tax or legal advice. Past performance does not guarantee future results, and precious metals involve risk. Please consult your own financial professional before making any investment decision.
More tools
Free investment guide
Rollovers, eligible coins, storage and fees, all explained in plain English. Free, with no obligation.